
Treatment.com AI Inc. (TRUE:CSE; TREIF:OTCMKTS; 939:FRA) has built a platform designed to impact today's healthcare challenges. The waste of time and resources in this industry is legendary, with patients often travelling long distances to see doctors and then hanging around sometimes for hours to see them just for a few minutes.
This is not the fault of doctors — a large percentage of their time is consumed by a heavy burden of repetitive bureaucracy. Enter Treatment AI.com. A platform with AI-driven systems that are designed to drastically reduce all these frictional losses to the great relief of both patients and Healthcare professionals. What makes the platform stand out and potentially earn the trust of the healthcare community is that Treatment is an AI healthcare platform built by doctors, combining clinical intelligence, virtual care, and voice AI in one trusted ecosystem.
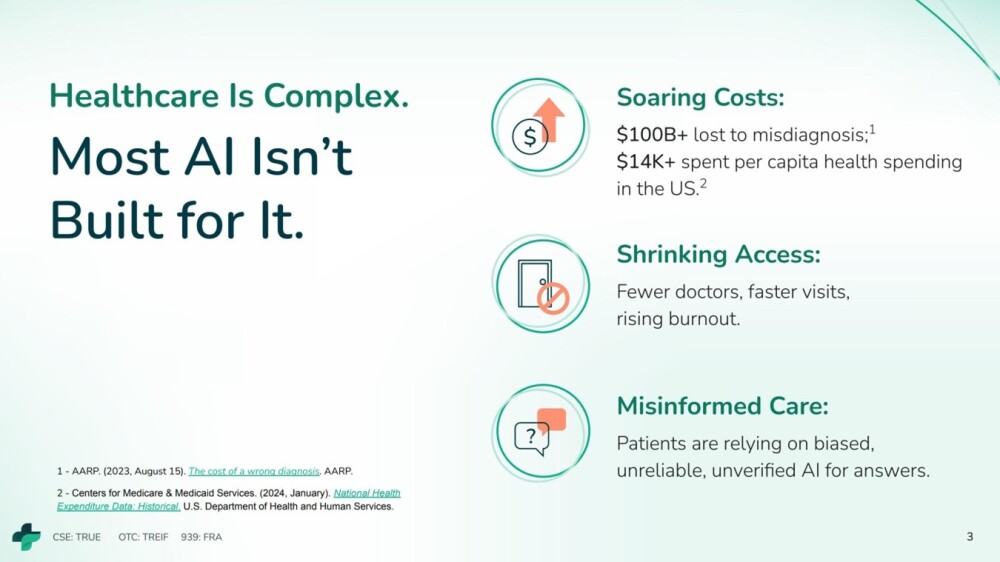
Here are the hitherto chronic, intractable healthcare system problems that Treatment AI.com's system is designed to address head-on.
Here is how Treatment AI.com aims to take Healthcare to the next level:

Those who are initially uncomfortable at the prospect of discussing health problems with an AI-Voice Assistant will feel a lot better about it when they consider the advantages — diagnosis and suggested treatment options do not depend on personality or on "what side of bed the doctor got out of in the morning" and are unwaveringly consistent, unbiased, and available 24/7.
Furthermore, the AI-Voice Assistant has an emotional component built into it so that it is able to respond in an appropriate manner to whatever is said to it, whilst at the same time functioning to keep the conversation on track.
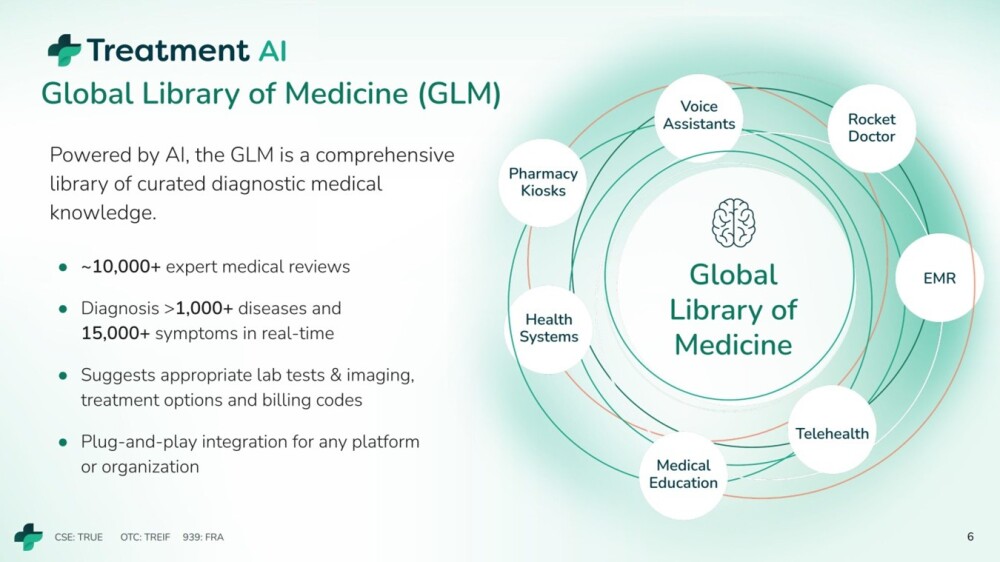
Treatment AI.com's Global Library of Medicine (GLM) is a massive medical resource built by doctors, which the system draws on continuously, enabling rapid and accurate diagnosis and selection of the most efficacious treatment options.
The end user — and healthcare professionals — can interface with the system in a number of different ways, including chatbots, voice assistants, and soon avatars.

Rocket Doctor has been described as a Shopify for physicians.
Backed by the GLM (Global Library of Medicine) and curated by hundreds of doctors worldwide, Treatment.com AI’s solution is designed to provide healthcare professionals with the most accurate and trusted diagnosis support.

And the platform is very easy for the customer / patient to use as they are guided in a step-by-step manner.

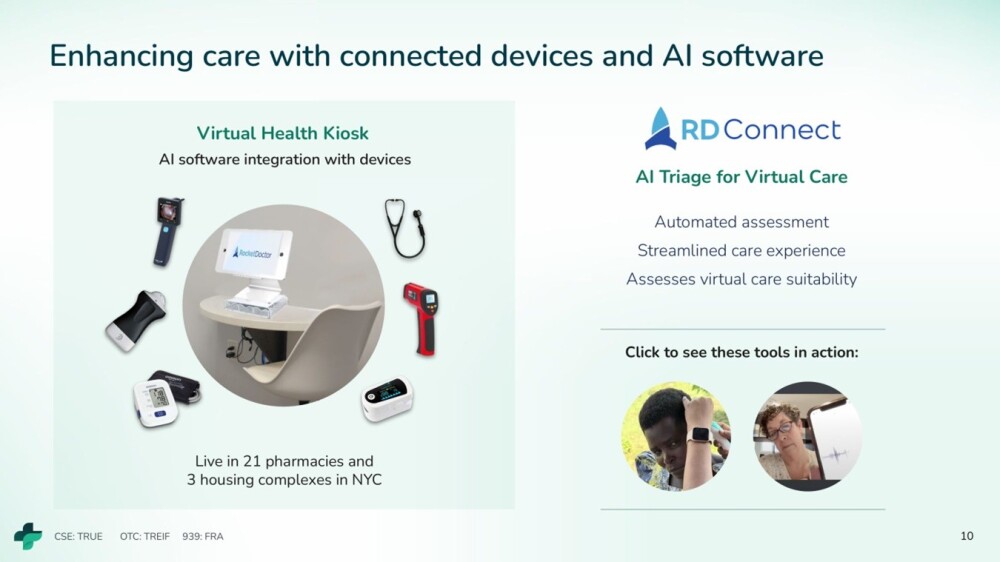
Treatment AI's platform has been developed to integrate smoothly with a broad range of other devices.
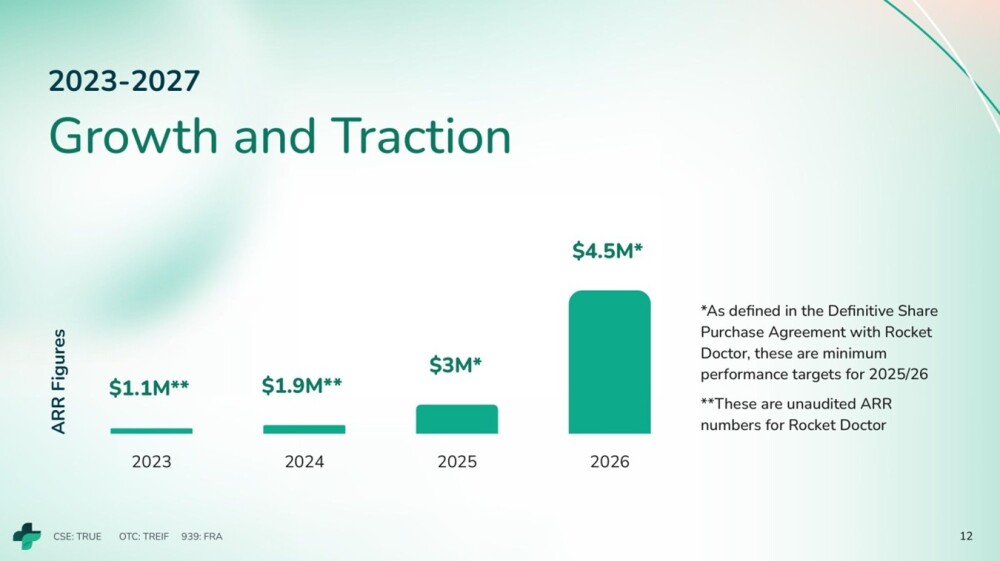
Rocket Doctor's current growth projections going forward are shown below.
Treatment AI.com and Rocket Doctor have already forged an array of relationships with leading organizations as well.

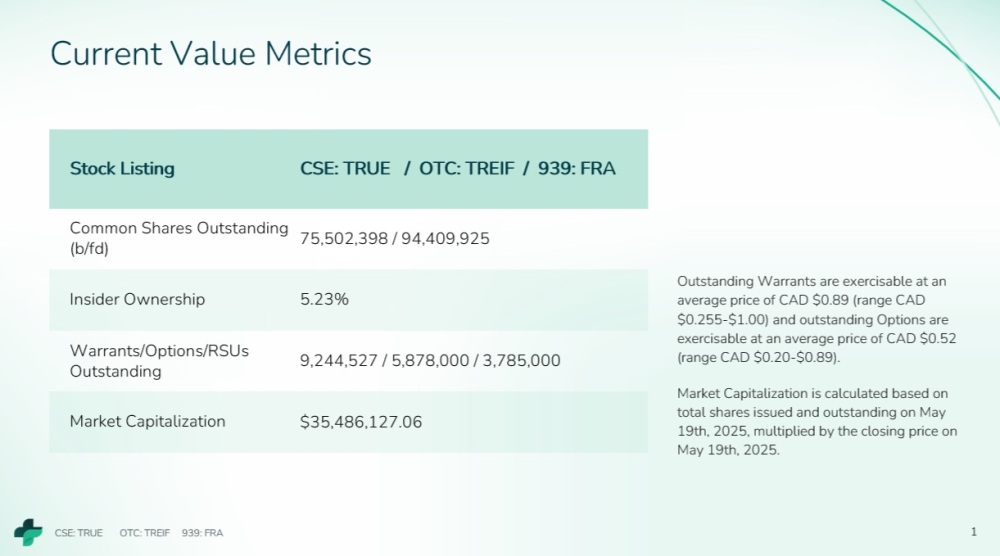
This last page from the investor deck shows the market cap and number of shares in issue, which is 75,503,398 million (94,409,925 fully diluted).
As has just been demonstrated by the above, Treatment AI.com is positioning to be a major player in the AI transformation of Healthcare and this being so, I believe the outlook for the company and its stock is very bright indeed.
Now, we review the latest stock charts for the company.
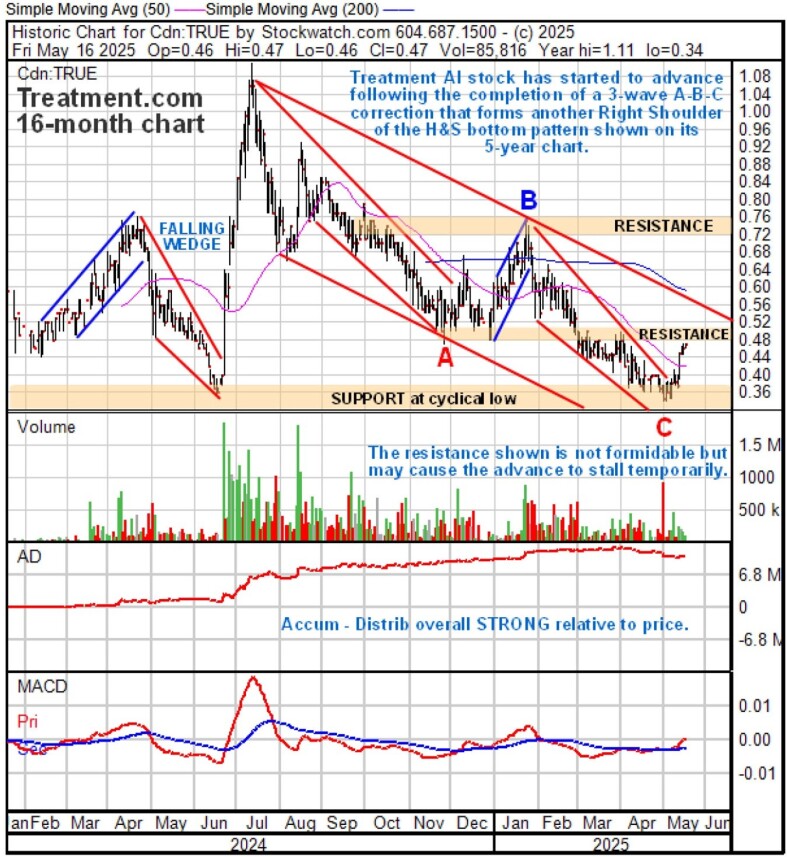
Starting with the 16-month chart we see that, after a runup in January, the stock dropped back to lower levels this Spring, which was not expected in the last update, and was due to a combination of a panicky selloff in the broad stock market, which has now recovered, coupled with AI stocks in general falling out of favor, but as we have seen above, that does not dim the prospects for this company.
Thus it now appears that the stock has just started higher again following the completion of a 3-wave A-B-C correction or selloff from its highs of last July that brought it down to a cyclical low at support at its lows of last June, and as we will see when we look at its longer-term chart, key long-term support held from which it is advancing anew.
We should keep in mind that the very strong volume driving the spectacular rally last June and July continues to have long-term bullish implications. Before leaving this chart, observe the overall strength of the Accumulation line, which supports a significant new uptrend developing from here, and it looks like it has already started.
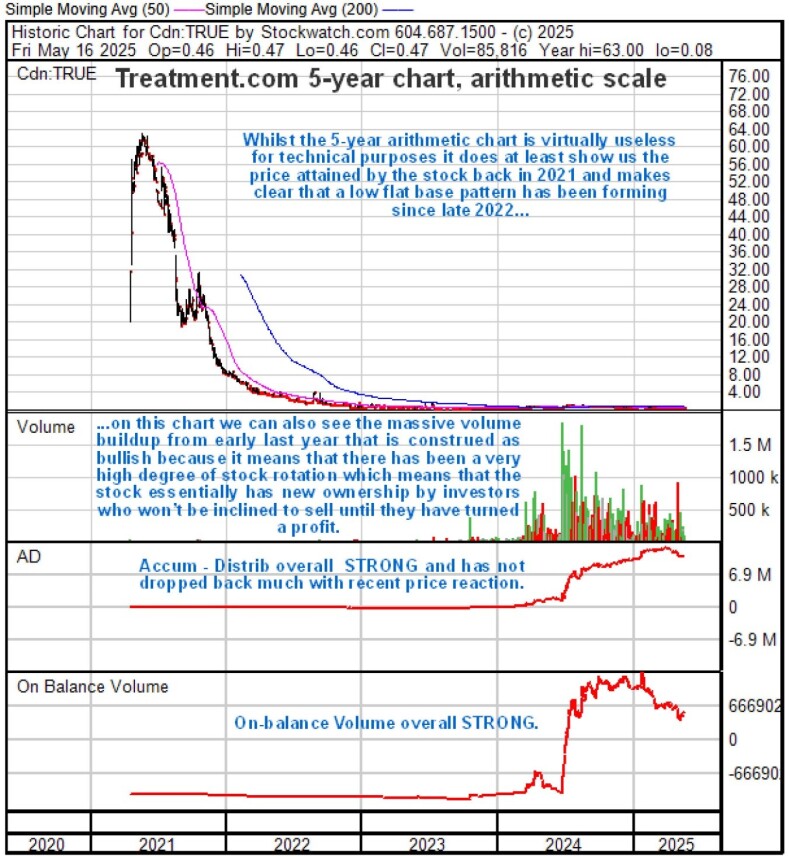
Turning now to the longer-term 5-year chart, it's worth looking first at an arithmetic version as this enables us to see the price attained by the stock at its peak towards the middle of 2021 when it got as high as about CA$63.00 and also that after it reached this peak it reversed into a severe bear market that erased most of its value by the end of 2022 after which it ran off sideways in a long, low base pattern that has persisted to this day.
Also on this chart, we can see the enormous volume buildup from early last year, which is viewed as very bullish because it means that a huge quantity of stock has changed hands during this period. The reason that this is bullish is because the sellers are mostly stale old holders who have given up on the company / stock, while the new buyers are looking forward to better times and will thus generally not be inclined to sell until they have turned a significant profit.
The longer-term 5-year log chart makes clear what has been going on within the large base pattern that has formed from late 2022 — a log scale is used to "open out" the base pattern, the better to see exactly what pattern has been completing. Here we see that a large complex Head-and-Shoulders bottom pattern with multiple shoulders has been building out during this period.
The duration of this base pattern has allowed time for the 200-day moving average to drop down close to the price, a frequent precursor to a new bull market. This pattern now looks mature, and given the extraordinarily bright prospects for the company, the time is believed to be at hand for the stock to advance to break out above the key resistance marking the upper boundary of the pattern into a major new bull market.
With the price just starting to advance off important support at the lower boundary of most of its range over the past 30 months or so with the prospect of a major breakout from its giant base pattern, we are believed to be very close to an optimum entry point and this is therefore viewed as an excellent time to buy or add to positions in Treatment AI.com. The first target for an advance is CA$1.08 – CA$1.12. The second target is CA$4.00, with much higher targets possible later.
Treatment.com AI Inc.'s website.
Treatment.com AI Inc. (TRUE:CSE; TREIF:OTCMKTS; 939:FRA) closed for trading at CA$0.445, US$0.3369 on May 20, 2025.
| Want to be the first to know about interesting Life Sciences Tools & Diagnostics and Technology investment ideas? Sign up to receive the FREE Streetwise Reports' newsletter. | Subscribe |
Important Disclosures:
- For this article, the Company has paid Street Smart, an affiliate of Streetwise Reports, US$1,500.
- As of the date of this article, officers and/or employees of Streetwise Reports LLC (including members of their household) own securities of Treatment.com AI Inc.
- Author Certification and Compensation: [Clive Maund of clivemaund.com] was retained and compensated as an independent contractor by Street Smart to write this article. Mr. Maund is a technical analyst who analyzes historical trading data and he received his UK Technical Analysts’ Diploma in 1989. The recommendations and opinions expressed in this content reflect the personal, independent, and objective views of the author regarding any and all of the companies discussed. No part of the compensation received by the author was, is, or will be directly or indirectly tied to the specific recommendations or views expressed.
- Statements and opinions expressed are the opinions of the author and not of Streetwise Reports, Street Smart, or their officers. The author is wholly responsible for the accuracy of the statements. Streetwise Reports requires contributing authors to disclose any shareholdings in, or economic relationships with, companies that they write about. Any disclosures from the author can be found below. Streetwise Reports relies upon the authors to accurately provide this information and Streetwise Reports has no means of verifying its accuracy.
- This article does not constitute investment advice and is not a solicitation for any investment. Streetwise Reports does not render general or specific investment advice and the information on Streetwise Reports should not be considered a recommendation to buy or sell any security. Each reader is encouraged to consult with his or her personal financial adviser and perform their own comprehensive investment research. By opening this page, each reader accepts and agrees to Streetwise Reports' terms of use and full legal disclaimer. Streetwise Reports does not endorse or recommend the business, products, services, or securities of any company.
For additional disclosures, please click here.
Clivemaund.com Disclosures
The above represents the opinion and analysis of Mr. Maund, based on data available to him, at the time of writing. Mr. Maund's opinions are his own, and are not a recommendation or an offer to buy or sell securities. As trading and investing in any financial markets may involve serious risk of loss, Mr. Maund recommends that you consult with a qualified investment advisor, one licensed by appropriate regulatory agencies in your legal jurisdiction, and do your own due diligence and research when making any kind of a transaction with financial ramifications. Although a qualified and experienced stock market analyst, Clive Maund is not a Registered Securities Advisor. Therefore Mr. Maund's opinions on the market and stocks cannot be construed as a recommendation or solicitation to buy and sell securities.


